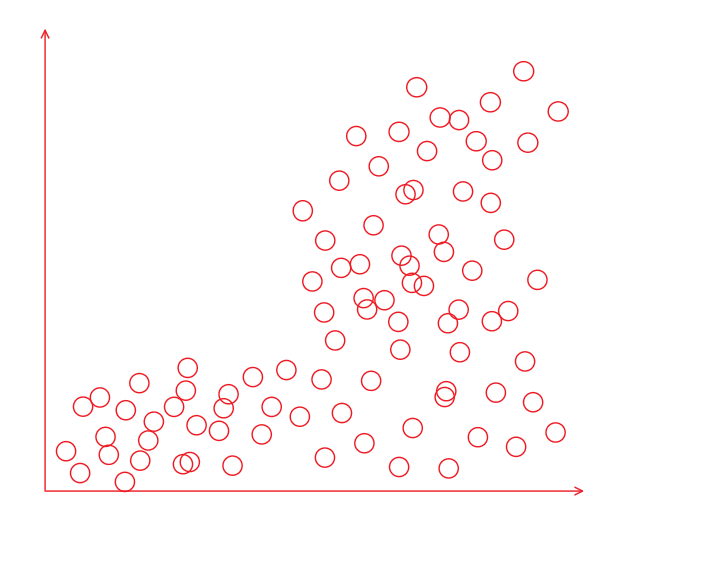
If you have data that look like those above, then you may have a threshold relationship where the changes in the dependent variable (y) are due to some functional shift caused by the independent variable (x). In 1998, a paper “From Star Charts to Stoneflies: Detecting Bivariate Patterns in Continuous Bivariate Data” was published in Ecology showing that some smart folks in astronomy had developed a statistical test that might be able to find nonrandom patterns in bivariate plots. “Star Charts” showed that this 2DKS test might be able to find non-random, putatively threshold changes in ecological data sets that are likely common in ecology but often fit (wrongly) with functional models such as non-linear regression.
“From Star Charts to Stoneflies: Detecting Relationships in Continuous Bivariate Data”
Many folks have asked for a usable version of the resulting “Star Charts” program to run the 2DKS test it described. It is fairly easy to code in a spreadsheet or with any program (e.g., R). However, my colleagues Dr. Dave Glover and Dr. Jahn Kallis were kind enough to develop a usable applet that can handle simple comma-delimited data sets (with a column for X and a column for Y data). You set your desired p-value and number of rerandomizations to generate your p-value (see the “Star Charts” paper for a description). The program shows you the possible combinations (“cloud”) of X,Y values that generate a significant threshold shift in your data. Easy peasy.
2DKS Program is available here. The code used to process your data differs from the approach in “Star Charts” in that it scrolls through all possible x,y pairs and their median values as recommended by “Fasano, G., and A. Franceschini. 1987. A multidimensional version of the Kolmogorov-Smirnov test. Monthly Notices of the Royal Astronomical Society 225:155–170”. The boxed cloud that results from the test include pairs of data that are not part of the actual data set but likely bracket the threshold area, with the x,y pair giving the lowest p-value being denoted a the “best value”. The Dbks test statistic is described in “Start Charts”.
If you choose to use this applet to analyze your data, please give Dave and Jahn credit: Glover, D. and J. Kallis. 2020. An application of the “Star Charts” ecological test to identify threshold relationships in ecological data.
Link to 2DKS test: https://fishysiu.shinyapps.io/2DKS_program/
